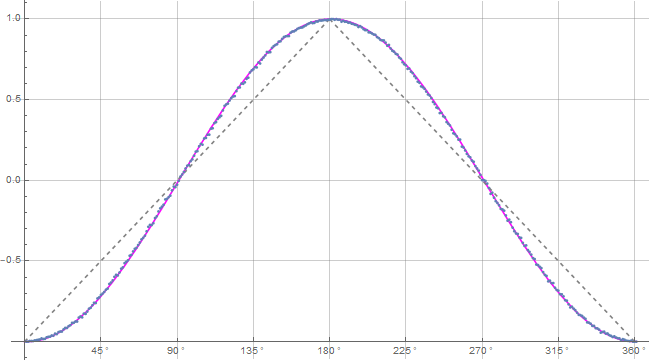
Nice work Fred. Getting rid of that .001 helps to make the program look more natural. The detection loophole is still alive and well. Using the routine Total I see that about 50% of the records are lost. This happens when values are compared to + or - 1. Quaternions are not integers and so the equality fails and those records are discarded. This will be hard to find for someone without Mathematica.FrediFizzx wrote: ↑Fri Dec 03, 2021 2:44 amHere is a 5 million trial plot to go with the update.FrediFizzx wrote: ↑Thu Dec 02, 2021 5:41 pmWell, that would be a partial thanks, but here is an update for you. Took out the 0.001's as they aren't needed after all.jreed wrote: ↑Thu Dec 02, 2021 2:19 pm I have looked at your latest version, and here are my comments:
You did a great job of getting things to fit the cosine curve. The fitting worked really well.
There are now two detectors for each observer. They generate two records for each experiment for each observer.
The detection loophole is still there. This is easy to see by adding the line of code:
Total[nPP + nPN + nNP + nNN]
after the statistical analysis. This will display how many records were saved out of the total of twice the number of trials.
I get about 50%. The rest were discarded.
The discarded records were those where 0.001 was added to the derived sign value, giving 1.001 or -0.999.
When these go through the statistical analysis, the program drops them since 1.001 is not equal to 1, and -0.999 is not equal to -1.
Cloud File
https://www.wolframcloud.com/obj/fredif ... c-forum.nb
Direct files.
download/CS-40-S3quat-3D-new-prodcalc-forum.pdf
download/CS-40-S3quat-3D-new-prodcalc-forum.nb
Enjoy!
Baby is still screamin' -a.b!
.
Re: Coming Soon!
Re: Re: Coming Soon!
-
FrediFizzx
- Independent Physics Researcher
- Posts: 432
- Joined: Thu Nov 04, 2021 1:44 pm
- Location: N. California, USA
- Contact:
Re: Re: Coming Soon!
Nope! Total Events = 4993634. So, we are only missing just a few events out of 5 million trials. Not enough for any detection loophole.
There is a flaw in the currently posted simulation but not a fatal flaw. See if you can find that instead of posting nonsense.
.
-
FrediFizzx
- Independent Physics Researcher
- Posts: 432
- Joined: Thu Nov 04, 2021 1:44 pm
- Location: N. California, USA
- Contact:
Re: Coming Soon!
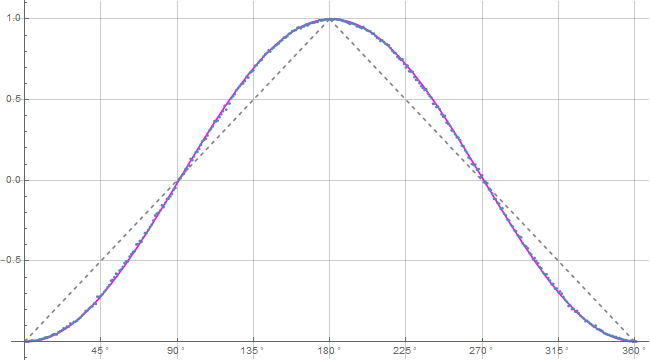
Alrighty, here's another freakin' update! This one updates the product calculation in the last version with the actual correct product calculation. Not that the last one was wrong. It was just for a different model. It was not for this particular simulation model. 5 million trials; one degree resolution.
Cloud File.
https://www.wolframcloud.com/obj/fredif ... c-forum.nb
Direct files.
sims/CS-41-S3quat-3D-new-prodcalc-forum.pdf
sims/CS-41-S3quat-3D-new-prodcalc-forum.nb
Enjoy!
.
Cloud File.
https://www.wolframcloud.com/obj/fredif ... c-forum.nb
Direct files.
sims/CS-41-S3quat-3D-new-prodcalc-forum.pdf
sims/CS-41-S3quat-3D-new-prodcalc-forum.nb
Enjoy!
.
Re: Re: Coming Soon!
Let's discuss how your program works. You set up an array of random angles on a unit sphere (s), then two random variables, lambda1 and lambda2, then go into a do loop for the samples generated by Alice and Bob. For Alice, a detector angle is found, and two comparisons are made with the quaternion product of that detector angle and the random angle s. These comparisons are with lambda1 and lambda2. For each comparison, if the absolute value of the real part of the quaternion product is greater then lambda, this is output as the detector angle, followed by the detector value, (+ or - 1). If the value is less than lambda, the detector angle, followed by a quaternion is output. This is done for both values of lambda, lambda1 and lambda2. That gives twice the number of sample points the program starts with. If you do 1 million tests, you get 2 million samples. This is also done for Bob's part.FrediFizzx wrote: ↑Fri Dec 03, 2021 12:37 pmNope! Total Events = 4993634. So, we are only missing just a few events out of 5 million trials. Not enough for any detection loophole.
These samples then go to the statistical analysis part of the program. Samples with +/- 1 are saved, but samples with quaternions are discarded. The program typically discards about 50% of the samples. This is why it appears that the program is analyzing all the samples, when actually it is only using about 50%. This is the origin of the detection loophole.
-
FrediFizzx
- Independent Physics Researcher
- Posts: 432
- Joined: Thu Nov 04, 2021 1:44 pm
- Location: N. California, USA
- Contact:
Re: Re: Coming Soon!
Nope! Mathematical artifacts, baby! We don't count the artifacts as any kind of detection. That would be quite silly. But the artifacts do serve a purpose. They keep events properly matched up so we don't have to do the matching like in the other simulation.jreed wrote: ↑Sat Dec 04, 2021 12:53 pmLet's discuss how your program works. You set up an array of random angles on a unit sphere (s), then two random variables, lambda1 and lambda2, then go into a do loop for the samples generated by Alice and Bob. For Alice, a detector angle is found, and two comparisons are made with the quaternion product of that detector angle and the random angle s. These comparisons are with lambda1 and lambda2. For each comparison, if the absolute value of the real part of the quaternion product is greater then lambda, this is output as the detector angle, followed by the detector value, (+ or - 1). If the value is less than lambda, the detector angle, followed by a quaternion is output. This is done for both values of lambda, lambda1 and lambda2. That gives twice the number of sample points the program starts with. If you do 1 million tests, you get 2 million samples. This is also done for Bob's part.FrediFizzx wrote: ↑Fri Dec 03, 2021 12:37 pmNope! Total Events = 4993634. So, we are only missing just a few events out of 5 million trials. Not enough for any detection loophole.
These samples then go to the statistical analysis part of the program. Samples with +/- 1 are saved, but samples with quaternions are discarded. The program typically discards about 50% of the samples. This is why it appears that the program is analyzing all the samples, when actually it is only using about 50%. This is the origin of the detection loophole.
.
-
gill1109
- Mathematical Statistician
- Posts: 204
- Joined: Thu Nov 04, 2021 10:17 pm
- Location: Apeldoorn, Netherlands
- Contact:
Re: Re: Coming Soon!
Thanks, John! This is very helpful.jreed wrote: ↑Sat Dec 04, 2021 12:53 pm Let's discuss how your program works. You set up an array of random angles on a unit sphere (s), then two random variables, lambda1 and lambda2, then go into a do loop for the samples generated by Alice and Bob. For Alice, a detector angle is found, and two comparisons are made with the quaternion product of that detector angle and the random angle s. These comparisons are with lambda1 and lambda2. For each comparison, if the absolute value of the real part of the quaternion product is greater then lambda, this is output as the detector angle, followed by the detector value, (+ or - 1). If the value is less than lambda, the detector angle, followed by a quaternion is output. This is done for both values of lambda, lambda1 and lambda2. That gives twice the number of sample points the program starts with. If you do 1 million tests, you get 2 million samples. This is also done for Bob's part.
These samples then go to the statistical analysis part of the program. Samples with +/- 1 are saved, but samples with quaternions are discarded. The program typically discards about 50% of the samples. This is why it appears that the program is analyzing all the samples, when actually it is only using about 50%. This is the origin of the detection loophole.
The program contains both elements of Joy’s original ideas and of Fred’s ideas with the three adjustable parameters. Two lambdas to make it more complicated and in order to disguise data rejection.
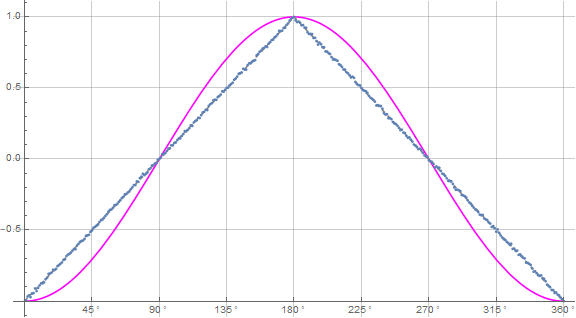
The last plot of the deviations shows that it does not exactly reproduce the negative cosine. I’m looking forward to see how Joy and Fred will try to sell this as physics.
The idea of duplicating each particle or particle pair has turned up many times before. Bryan Sanctuary did that. @Esail (Eugen Muchowski) does it too.
-
FrediFizzx
- Independent Physics Researcher
- Posts: 432
- Joined: Thu Nov 04, 2021 1:44 pm
- Location: N. California, USA
- Contact:
Re: Coming Soon!
Double LOL!  Here we have a couple of Bell fanatics that are so bent out of shape by mathematical artifacts, they don't notice that the product calculation is going from 0 to +1 instead of -1 to +1.
I smell another sim update COMING SOON!
.
I smell another sim update COMING SOON!
.
-
Joy Christian
- Research Physicist
- Posts: 169
- Joined: Fri Nov 05, 2021 2:26 pm
- Location: Oxford, United Kingdom
- Contact:
Re: Re: Coming Soon!
There is no data rejection in Fred's code.
Bell's detectors only detect plus or minus results: A = +/-1, B = +/-1. Bell's detectors do not detect quaternions. Anyone who claims that quaternions must be considered data does not know what Bell's theorem is all about. If they claim that they are "experts" in Bell's theorem, then they are kidding themselves.
Look for a flaw in the code other than data rejection. If you are truly an expert in Bell's theorem, then you should be able to find one --- a genuine one.
.
-
FrediFizzx
- Independent Physics Researcher
- Posts: 432
- Joined: Thu Nov 04, 2021 1:44 pm
- Location: N. California, USA
- Contact:
Re: Re: Coming Soon!
That's the problem for the Bell fanatics. They can't find any flaws because there isn't any.Joy Christian wrote: ↑Sun Dec 05, 2021 2:07 amThere is no data rejection in Fred's code.
Bell's detectors only detect plus or minus results: A = +/-1, B = +/-1. Bell's detectors do not detect quaternions. Anyone who claims that quaternions must be considered data does not know what Bell's theorem is all about. If they claim that they are "experts" in Bell's theorem, then they are kidding themselves.
Look for a flaw in the code other than data rejection. If you are truly an expert in Bell's theorem, then you should be able to find one --- a genuine one.
.
Re: Re: Coming Soon!
If you want to see the effects of data rejection, remove or comment lambda1 and lambda2 in the first do-loop. Then replace these with: This will do away with data rejection. You will now get all events in the calculation. The output plot will be a perfect triangle. No samples will be discarded. No artifacts baby.
Code: Select all
lambda1[[i]]=lambda2[[i]]=0.
Last edited by FrediFizzx on Sun Dec 05, 2021 3:46 pm, edited 1 time in total.
Reason: Fixed code entry.
Reason: Fixed code entry.
-
FrediFizzx
- Independent Physics Researcher
- Posts: 432
- Joined: Thu Nov 04, 2021 1:44 pm
- Location: N. California, USA
- Contact:
Re: Re: Coming Soon!
Triple LOL!jreed wrote: ↑Sun Dec 05, 2021 2:13 pm If you want to see the effects of data rejection, remove or comment lambda1 and lambda2 in the first do-loop. Then replace these with:This will do away with data rejection. You will now get all events in the calculation. The output plot will be a perfect triangle. No samples will be discarded. No artifacts baby.Code: Select all
lambda1[[i]]=lambda2[[i]]=0.
.
-
FrediFizzx
- Independent Physics Researcher
- Posts: 432
- Joined: Thu Nov 04, 2021 1:44 pm
- Location: N. California, USA
- Contact:
 Re: Coming Soon!
Whew! Finally got the product calculation working correctly. It's a freakin' doozy! 1 million trials this time; 1 degree resolution.
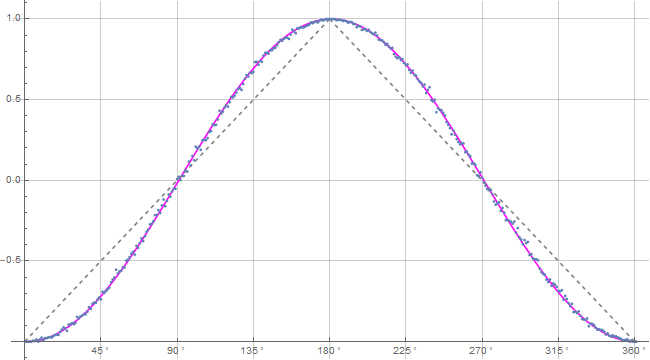
Product calculation verification.
Blue is data and magenta is the -cosine curve for an exact match!
Cloud File.
https://www.wolframcloud.com/obj/fredif ... c-forum.nb
Direct Files.
sims/CS-42-S3quat-3D-new-prodcalc-forum.pdf
sims/CS-42-S3quat-3D-new-prodcalc-forum.nb
Enjoy!
.
Product calculation verification.
Blue is data and magenta is the -cosine curve for an exact match!
Cloud File.
https://www.wolframcloud.com/obj/fredif ... c-forum.nb
Direct Files.
sims/CS-42-S3quat-3D-new-prodcalc-forum.pdf
sims/CS-42-S3quat-3D-new-prodcalc-forum.nb
Enjoy!
.
Re: Re: Coming Soon!
I thought you might be interested in trying this experiment yourself. I assumed you want to understand how the cosine curve is generated. Maybe you aren't.FrediFizzx wrote: ↑Sun Dec 05, 2021 2:17 pmTriple LOL!jreed wrote: ↑Sun Dec 05, 2021 2:13 pm If you want to see the effects of data rejection, remove or comment lambda1 and lambda2 in the first do-loop. Then replace these with:This will do away with data rejection. You will now get all events in the calculation. The output plot will be a perfect triangle. No samples will be discarded. No artifacts baby.Code: Select all
lambda1[[i]]=lambda2[[i]]=0.
.
-
FrediFizzx
- Independent Physics Researcher
- Posts: 432
- Joined: Thu Nov 04, 2021 1:44 pm
- Location: N. California, USA
- Contact:
Re: Re: Coming Soon!
Well thanks, but there is an easier way. Set beta and xi to 0. And..., I already understand perfectly well how the -cosine curve is generated.
You won't find a flaw in the simulation so you should just do yourself a favor and admit defeat.
.
Re: Re: Coming Soon!
If you add the Total statement in that run of the program, you would find all samples are used. What do you conclude from that?
-
FrediFizzx
- Independent Physics Researcher
- Posts: 432
- Joined: Thu Nov 04, 2021 1:44 pm
- Location: N. California, USA
- Contact:
Re: Re: Coming Soon!
After the statistical analysis of events loop, add the following statement in both your normal calculation and lambda = 0 calculation:
Total[nPP + nPN + nNP + nNN]
this will show how many samples were used in each calculation. In the example with lambdas not equal zero, you''ll see about 50% samples used and the cosine curve calculated. In the example with lambdas equal zero you'll see 100% samples used and the triangle curve calculated. What do you conclude from that?
-
FrediFizzx
- Independent Physics Researcher
- Posts: 432
- Joined: Thu Nov 04, 2021 1:44 pm
- Location: N. California, USA
- Contact:
Re: Re: Coming Soon!
Absolutely nothing! As I said before, we don't count mathematical artifacts as valid detections. The valid detections for 5 million trials, Total Events Detected = 4 998 238. You really should admit that Bell's theory is junk physics.jreed wrote: ↑Mon Dec 06, 2021 4:06 pm After the statistical analysis of events loop, add the following statement in both your normal calculation and lambda = 0 calculation:
Total[nPP + nPN + nNP + nNN]
this will show how many samples were used in each calculation. In the example with lambdas not equal zero, you''ll see about 50% samples used and the cosine curve calculated. In the example with lambdas equal zero you'll see 100% samples used and the triangle curve calculated. What do you conclude from that?
.
-
FrediFizzx
- Independent Physics Researcher
- Posts: 432
- Joined: Thu Nov 04, 2021 1:44 pm
- Location: N. California, USA
- Contact:
Re: Re: Coming Soon!
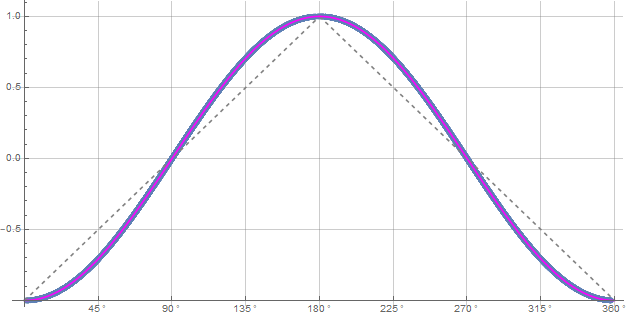
Time for you Bell fanatics to get real and finally admit that you have been following junk physics for years! This plot right here says that it is junk physics and Joy basically did this in 2007. No +/-1's needed. This new simulation says that Gill's math theory is junk also and that he has NO proof.FrediFizzx wrote: ↑Mon Dec 06, 2021 5:23 pmAbsolutely nothing! As I said before, we don't count mathematical artifacts as valid detections. The valid detections for 5 million trials, Total Events Detected = 4 998 238. You really should admit that Bell's theory is junk physics.jreed wrote: ↑Mon Dec 06, 2021 4:06 pm After the statistical analysis of events loop, add the following statement in both your normal calculation and lambda = 0 calculation:
Total[nPP + nPN + nNP + nNN]
this will show how many samples were used in each calculation. In the example with lambdas not equal zero, you''ll see about 50% samples used and the cosine curve calculated. In the example with lambdas equal zero you'll see 100% samples used and the triangle curve calculated. What do you conclude from that?
Blue is data and magenta is the -cosine curve for an exact match!
.
-
FrediFizzx
- Independent Physics Researcher
- Posts: 432
- Joined: Thu Nov 04, 2021 1:44 pm
- Location: N. California, USA
- Contact:
Re: Re: Coming Soon!
Looks like I forgot to address more of Gill's nonsense above. Actually this simulation is mostly based on Michel's epr-simple as the title says. The quaternions are from John's poorly done simulation of Joy's model (he forgot to put in the singlet particle pair).gill1109 wrote: ↑Sat Dec 04, 2021 9:54 pmThanks, John! This is very helpful.jreed wrote: ↑Sat Dec 04, 2021 12:53 pm Let's discuss how your program works. You set up an array of random angles on a unit sphere (s), then two random variables, lambda1 and lambda2, then go into a do loop for the samples generated by Alice and Bob. For Alice, a detector angle is found, and two comparisons are made with the quaternion product of that detector angle and the random angle s. These comparisons are with lambda1 and lambda2. For each comparison, if the absolute value of the real part of the quaternion product is greater then lambda, this is output as the detector angle, followed by the detector value, (+ or - 1). If the value is less than lambda, the detector angle, followed by a quaternion is output. This is done for both values of lambda, lambda1 and lambda2. That gives twice the number of sample points the program starts with. If you do 1 million tests, you get 2 million samples. This is also done for Bob's part.
These samples then go to the statistical analysis part of the program. Samples with +/- 1 are saved, but samples with quaternions are discarded. The program typically discards about 50% of the samples. This is why it appears that the program is analyzing all the samples, when actually it is only using about 50%. This is the origin of the detection loophole.
The program contains both elements of Joy’s original ideas and of Fred’s ideas with the three adjustable parameters. Two lambdas to make it more complicated and in order to disguise data rejection.
The last plot of the deviations shows that it does not exactly reproduce the negative cosine. I’m looking forward to see how Joy and Fred will try to sell this as physics.
The idea of duplicating each particle or particle pair has turned up many times before. Bryan Sanctuary did that. @Esail (Eugen Muchowski) does it too.
The two lambdas are NOT to disguise data rejection. We simply DO NOT count mathematical artifacts. The two lambdas have to be the way Nature works since we get the correct results.
And..., look how fast Gill forgets the Diether-Gull theorem! It is impossible to make a continuous curve using digital data like +/-1's. You can always find a hole between data points! That is basically what the deviation plot is showing us.
.
